UPI Transactions Decline 5% MoM in February 2025 After Consecutive Record Highs
UPI transactions in India declined 5% MoM in February 2025, breaking a two-month record streak. However, YoY growth remains strong. Read more about market trends, fintech app dominance, and future projections.
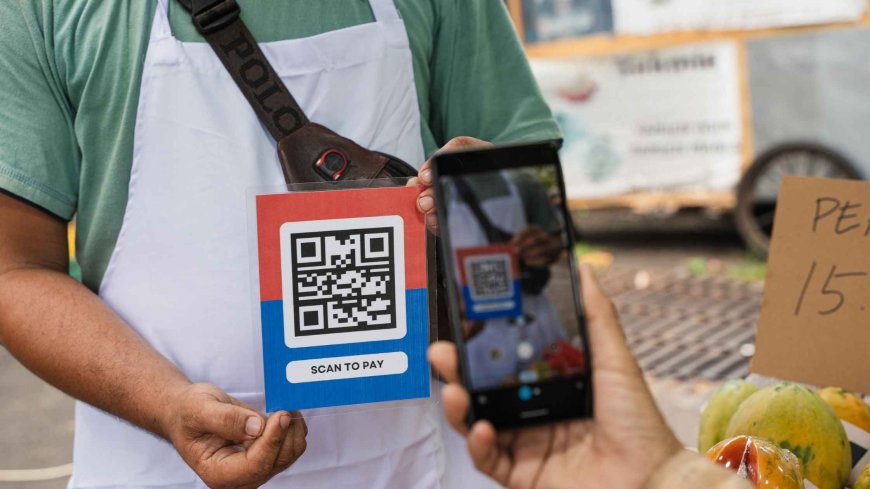
Unified Payments Interface (UPI) transactions in India witnessed a month-on-month (MoM) decline of over 5% in February 2025, marking the end of a two-month streak of record-high transactions. According to data released by the National Payments Corporation of India (NPCI), UPI transaction volume dropped to 16.11 billion in February from 16.99 billion in January, reflecting a 3.7% decrease compared to December 2024.


UPI Transaction Value Sees 6.47% Decline
The total value of UPI transactions fell by 6.47% to INR 21.96 lakh crore in February, down from INR 23.48 lakh crore in January 2025. However, on a year-on-year (YoY) basis, UPI transactions registered a 33% increase in volume and a 20% rise in transaction value, indicating sustained long-term growth despite the temporary decline.
Average Daily Transactions Increase
Despite the overall monthly decline, average daily UPI transactions rose to 575 million in February, up from 548 million in January. Additionally, the average daily transaction value increased by 3.56%, reaching INR 78,446 crore from INR 75,743 crore in the previous month.
UPI’s Growth in 2024 and Future Projections
UPI transactions surged 46% in 2024, reaching a record 17,220 crore transactions, compared to 11,768 crore in 2023. This rapid adoption was fueled by the increasing popularity of fintech apps such as PhonePe, Paytm, and CRED, which have simplified digital payments for millions of users.
According to the Payments System Report 2024 by the Reserve Bank of India (RBI), UPI accounted for 17,221 crore transactions out of the 20,787 crore digital payments recorded during the year. Given the current trajectory, the RBI projects that UPI transactions will soon hit 1 billion per day, reinforcing India’s dominance in digital payments.
Market Share of UPI Apps: PhonePe Leads, Paytm Slips Further
Fintech giant PhonePe maintained its lead in the UPI ecosystem, processing 810.2 crore transactions in January 2025, capturing over 48% of the market share. Google Pay held the second position with a 36.91% market share.
Meanwhile, Paytm's market share continued to decline, dropping to 6.87% in January 2025, down from 6.97% in December 2024 and 7.03% in November 2024.
NPCI’s 30% Market Share Cap on TPAPs
In December 2024, NPCI extended the deadline for implementing a 30% market share cap on third-party app providers (TPAPs), such as PhonePe and Google Pay, by another two years. Originally proposed in November 2020, the cap aims to prevent monopolization in the digital payments space. However, both PhonePe and Google Pay continue to dominate, with each holding more than 30% market share in India’s UPI transactions.
What's Your Reaction?
 Like
0
Like
0
 Dislike
0
Dislike
0
 Love
0
Love
0
 Funny
0
Funny
0
 Wow
0
Wow
0
 Sad
0
Sad
0
 Angry
0
Angry
0


Comments (0)